Import Library
import numpy as np

import pandas as pd

import matplotlib.pyplot as pltLoad Data
df =pd.read_csv(r'C:\Users\oleetech\Downloads\purchase.csv',encoding='unicode_escape')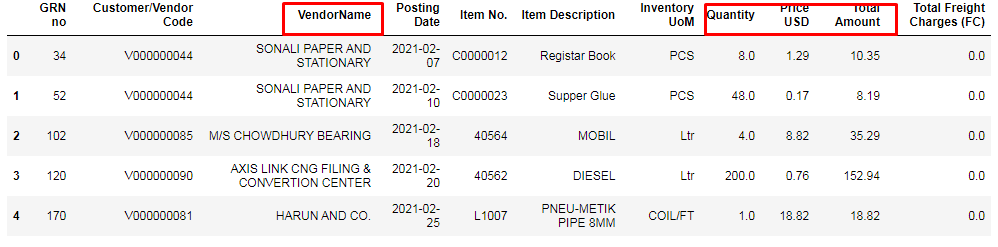
Get Column info
print(df.columns)output
Index(['Category', 'GRN no', 'Customer/Vendor Code', 'VendorName', 'Address',
       'LC No', 'Posting Date', 'Item No.', 'Item Description',
       'Inventory UoM', 'Quantity', 'Price', 'Price USD', 'Total Amount'],
dtype='object')Convert Datatype
# Convert the 'Total Amount' column to numeric
df['Total Amount'] = df['Total Amount'].str.replace(',', '').astype(float)


# Convert the 'Posting Date' column to a datetime format
df['Posting Date']= pd.to_datetime(df['Posting Date'])Define Date range
# Define the date range
start_date="2021-04-10"
end_date="2021-12-31"Filter Dataframe
# filter dataframe between date
filtered_df= df[(df['Posting Date'] >= start_date ) & (df['Posting Date'] <= end_date )]Groupby and sort Dataframe
result = filtered_df.groupby('VendorName')['Total Amount'].sum().reset_index()
top10vendors=result.sort_values(by='Total Amount',ascending=False).head(10)Create Chart
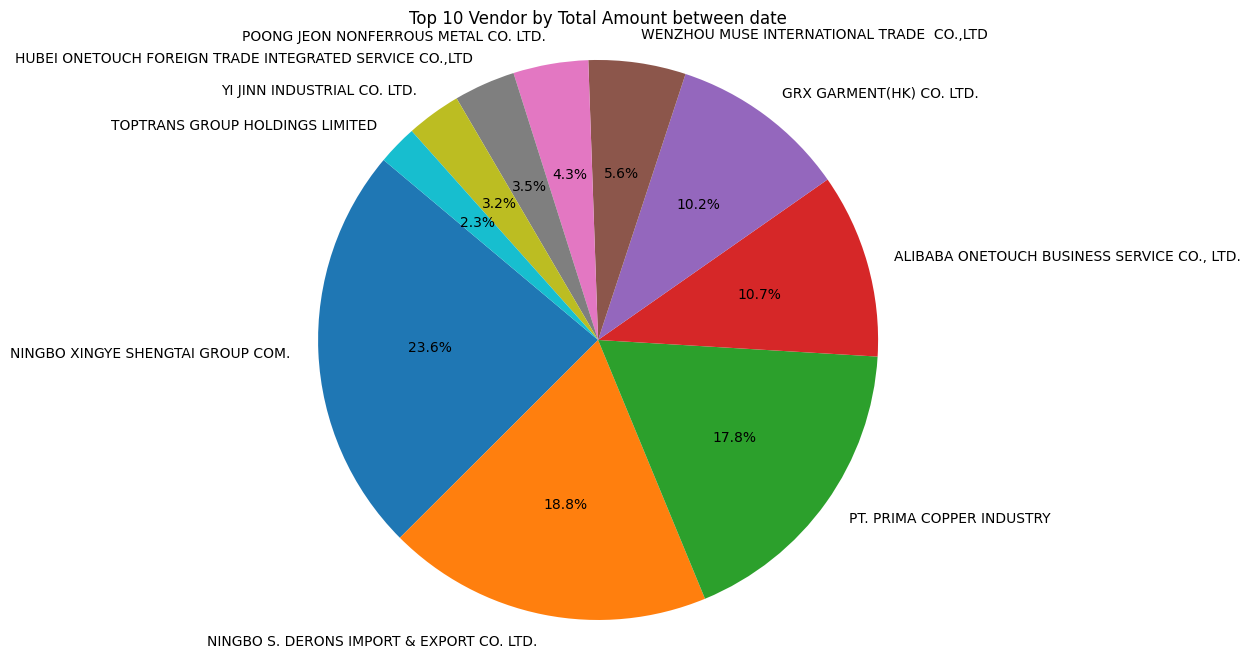
# Create a pie chart
plt.figure(figsize=(10,8))
plt.pie(top10vendors['Total Amount'],labels=top10vendors['VendorName'],autopct='%1.1f%%',startangle=140)
plt.axis('equal')
# plt.bar(top10vendors['VendorName'],top10vendors['Total Amount'])
# # Rotate the x-axis labels for better readability (optional)
# plt.xticks(rotation=90)
plt.title('Top 10 Vendor by Total Amount between date')
plt.savefig('top_vendors_chart.png', bbox_inches='tight')
plt.show()